Imagine a tool that could dramatically improve your stock market trading success by providing clear signals for when to buy and sell. This tool exists, and it’s known as candlestick patterns.
By recognizing these patterns, traders can make more informed decisions, leading to more profitable outcomes.
In this comprehensive guide, we’ll explore the most effective candlestick patterns, focusing on both bullish and bearish indicators, to help you navigate the complexities of the market and boost your trading strategy.

Understanding Bullish Candlestick Patterns
Bullish Shooting Star
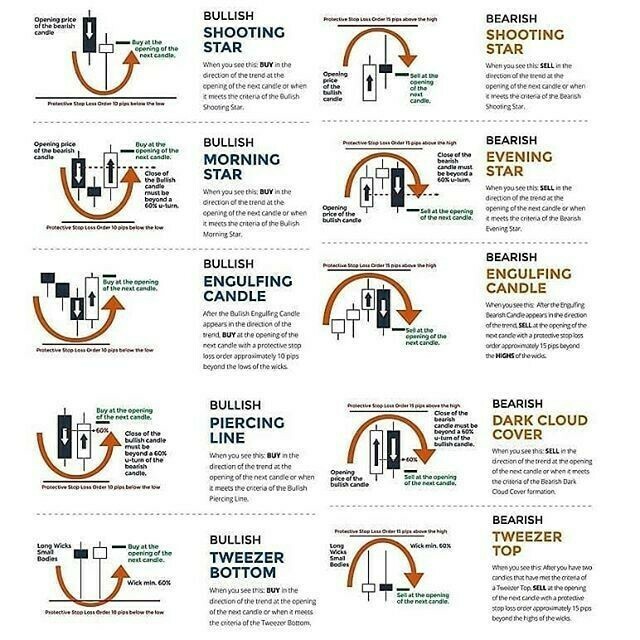
The Bullish Shooting Star pattern indicates a potential reversal from a downtrend to an uptrend. It appears after a series of bearish candles, signaling a potential buying opportunity.
Key Features:
-
- Shape: A small body with a long upper shadow.
- Action: Buy at the opening of the next candle.
- Protective Stop Loss: 60% below the low of the Shooting Star candle.
Bullish Morning Star
The Bullish Morning Star pattern is a powerful reversal signal appearing at the end of a downtrend. This three-candle pattern can lead to significant upward price movement.
Key Features:
-
- First Candle: Long bearish candle.
- Second Candle: Small body (bearish or bullish).
- Third Candle: Long bullish candle closing above the midpoint of the first candle.
- Action: Buy at the opening of the next candle.
- Protective Stop Loss: 60% below the low of the Morning Star pattern.
Bullish Engulfing Candle
The Bullish Engulfing Candle is a two-candle reversal pattern that suggests a strong upward move is imminent.
Key Features:
-
- First Candle: Small bearish candle.
- Second Candle: Large bullish candle engulfing the previous candle.
- Action: Buy at the opening of the next candle.
- Protective Stop Loss: 60% below the low of the Engulfing Candle.
Bullish Piercing Line
The Bullish Piercing Line pattern signals a potential reversal from a downtrend to an uptrend.
Key Features:
-
- First Candle: Long bearish candle.
- Second Candle: Bullish candle opening lower and closing above the midpoint of the first candle.
- Action: Buy at the opening of the next candle.
- Protective Stop Loss: 60% below the low of the Piercing Line pattern.
Bullish Tweezer Bottom
The Bullish Tweezer Bottom pattern indicates a potential bottom and subsequent upward move.
Key Features:
-
- Two Candles: Both candles have similar lows.
- Action: Buy at the opening of the next candle.
- Protective Stop Loss: 60% below the low of the Tweezer Bottom pattern.
Exploring Bearish Candlestick Patterns
Bearish Shooting Star
The Bearish Shooting Star pattern signals a potential reversal from an uptrend to a downtrend.
Key Features:
-
- Shape: A small body with a long upper shadow.
- Action: Sell at the opening of the next candle.
- Protective Stop Loss: 60% above the high of the Shooting Star candle.
Bearish Evening Star
The Bearish Evening Star pattern is a powerful reversal signal appearing at the end of an uptrend.
Key Features:
-
- First Candle: Long bullish candle.
- Second Candle: Small body (bearish or bullish).
- Third Candle: Long bearish candle closing below the midpoint of the first candle.
- Action: Sell at the opening of the next candle.
- Protective Stop Loss: 60% above the high of the Evening Star pattern.
Bearish Engulfing Candle
The Bearish Engulfing Candle is a two-candle reversal pattern that suggests a strong downward move is imminent.
Key Features:
-
- First Candle: Small bullish candle.
- Second Candle: Large bearish candle engulfing the previous candle.
- Action: Sell at the opening of the next candle.
- Protective Stop Loss: 60% above the high of the Engulfing Candle.
Bearish Dark Cloud Cover
The Bearish Dark Cloud Cover pattern signals a potential reversal from an uptrend to a downtrend.
Key Features:
-
- First Candle: Long bullish candle.
- Second Candle: Bearish candle opening higher and closing below the midpoint of the first candle.
- Action: Sell at the opening of the next candle.
- Protective Stop Loss: 60% above the high of the Dark Cloud Cover pattern.
Bearish Tweezer Top
The Bearish Tweezer Top pattern indicates a potential top and subsequent downward move.
Key Features:
-
- Two Candles: Both candles have similar highs.
- Action: Sell at the opening of the next candle.
- Protective Stop Loss: 60% above the high of the Tweezer Top pattern.
Advanced Topics: Enhancing Your Candlestick Pattern Strategy
Combining Candlestick Patterns with Technical Indicators
Integrating technical indicators with candlestick patterns can provide more reliable trading signals.
Popular Indicators:
-
- Moving Averages: Help identify trends and potential reversals.
- Relative Strength Index (RSI): Indicates overbought or oversold conditions.
- Bollinger Bands: Show volatility and potential price breakouts.
Recognizing False Signals
Not all candlestick patterns lead to successful trades. Understanding false signals is crucial.
Tips to Avoid False Signals:
-
- Confirm with Volume: Higher volume adds credibility to the pattern.
- Use Multiple Timeframes: Verify patterns on different timeframes for consistency.
- Consider Market Context: Be aware of broader market trends and news.
Emerging Trends in Candlestick Patterns
Stay updated with the latest trends to refine your trading strategies.
Current Trends:
-
- Algorithmic Trading: Leveraging AI to identify patterns.
- Sentiment Analysis: Using social media and news to gauge market sentiment.
- Enhanced Charting Tools: Advanced software for detailed analysis.
Practical Tips and Best Practices for Trading with Candlestick Patterns
Developing a Trading Plan
A well-defined trading plan is essential for success.
Key Components:
-
- Entry and Exit Points: Based on specific patterns.
- Risk Management: Setting stop-loss and take-profit levels.
- Review and Adapt: Regularly assess and adjust your strategy.
Platform-Specific Strategies
Different trading platforms offer unique features and tools.
Example Platforms:
-
- MetaTrader 4/5: Extensive charting and analysis tools.
- Thinkorswim: Advanced analytics and customizable features.
- TradingView: Social networking for traders and detailed charting capabilities.
Learning from Successful Traders
Studying the strategies of successful traders can provide valuable insights.
Examples of Strategies:
-
- Swing Trading: Using candlestick patterns for short to medium-term trades.
- Scalping: Leveraging patterns for quick, small gains.
- Position Trading: Holding trades based on long-term patterns.
Frequently Asked Questions (FAQs)
1. What is a candlestick pattern?
Candlestick patterns are formations created by one or more candlesticks in a price chart, indicating potential market reversals or continuations.
2. How reliable are candlestick patterns?
Candlestick patterns can be reliable when combined with other technical indicators and proper risk management.
3. Can candlestick patterns be used in all markets?
Yes, candlestick patterns can be applied to stocks, forex, commodities, and cryptocurrencies.
4. How do I start using candlestick patterns?
Begin by studying basic patterns and gradually incorporate them into your trading strategy.
5. What is the best time frame for candlestick patterns?
The best time frame depends on your trading style, but daily and weekly charts are commonly used for significant patterns.
Pros and Cons of Using Candlestick Patterns
Pros:
- Visual Clarity: Easy to identify patterns.
- Versatility: Applicable to various markets.
- Actionable Insights: Clear buy and sell signals.
Cons:
- False Signals: Can lead to incorrect trades.
- Learning Curve: Requires practice and study.
- Dependency on Other Indicators: More effective when used with additional analysis tools.
Conclusion: Maximizing Your Trading Success with Candlestick Patterns
Candlestick patterns are powerful tools for traders. They provide clear signals for market entry and exit points. By understanding and applying these patterns, you can enhance your trading strategy and increase profitability.
Getting Started with Candlestick Patterns
Action Steps:
- Study Patterns: Begin with basic patterns and progress to advanced ones.
- Practice: Use demo accounts to practice identifying and trading patterns.
- Analyze: Combine patterns with technical indicators for better accuracy.
- Stay Updated: Follow market trends and continuously improve your knowledge.
Call to Action: Enhance Your Trading Journey
Join our free resource and training center for online entrepreneurs at WiFiEntrepreneur.com/training-center. Leave a comment below to share your thoughts or ask questions about candlestick patterns. Let’s build a community of successful traders together!

