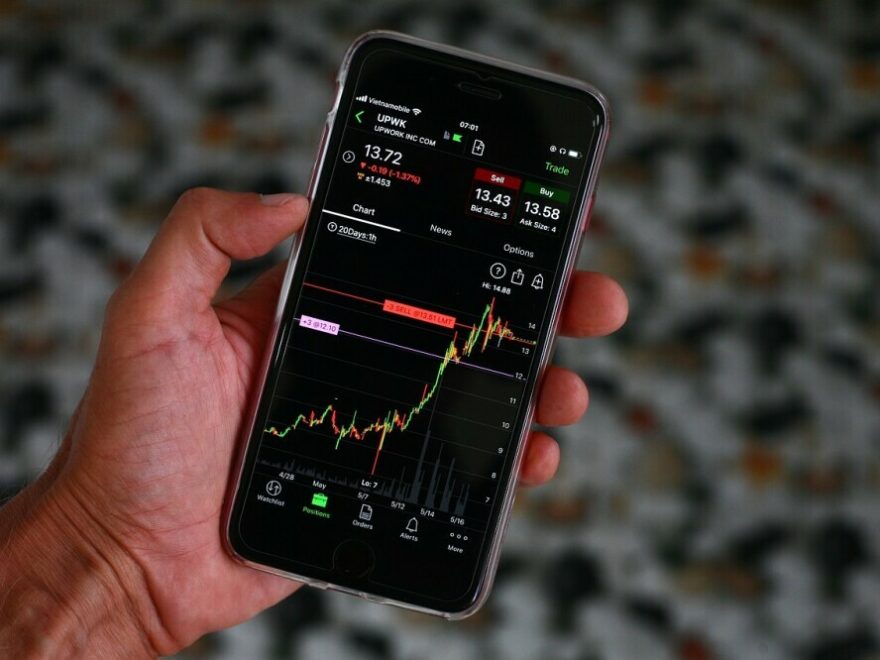
In the fast-paced world of trading, having the right tools at your disposal can make all the difference. Whether you’re a beginner or a seasoned trader, leveraging the best TradingView indicators can significantly enhance your trading strategy.
These indicators provide valuable insights into market trends, helping you make informed decisions and maximize your profits.
In this article, we will explore the top TradingView indicators, their benefits, and how you can use them to boost your trading success.

Understanding TradingView Indicators: Your Gateway to Smarter Trading
What Are TradingView Indicators?
TradingView indicators are technical analysis tools that help traders analyze price movements, identify trends, and make informed trading decisions. They are designed to provide visual cues on charts, making it easier to understand market dynamics and predict future price movements.
Why Use TradingView Indicators?
- Enhanced Market Analysis: Indicators simplify complex data, making it easier to analyze market trends and patterns.
- Informed Decision-Making: With accurate signals, traders can make more confident decisions, reducing the risk of losses.
- Time Efficiency: Indicators save time by providing quick insights, allowing traders to act promptly on trading opportunities.
How Do TradingView Indicators Work?
TradingView indicators work by applying mathematical calculations to historical price data. They generate signals based on these calculations, indicating potential buy or sell opportunities. Traders can customize indicators to suit their trading style and preferences.
Top TradingView Indicators for Successful Trading
1. Relative Strength Index (RSI)
Overview: The Relative Strength Index (RSI) is a momentum oscillator that measures the speed and change of price movements. It helps identify overbought or oversold conditions in the market.
How to Use:
- Overbought Signal: RSI above 70 indicates an overbought condition, suggesting a potential sell opportunity.
- Oversold Signal: RSI below 30 indicates an oversold condition, suggesting a potential buy opportunity.
2. Moving Average Convergence Divergence (MACD)
Overview: The Moving Average Convergence Divergence (MACD) is a trend-following momentum indicator. It shows the relationship between two moving averages of a security’s price.
How to Use:
- Buy Signal: When the MACD line crosses above the signal line.
- Sell Signal: When the MACD line crosses below the signal line.
3. Bollinger Bands
Overview: Bollinger Bands consist of a middle band (a moving average) and two outer bands representing standard deviations. They help identify volatility and potential price reversals.
How to Use:
- Buy Signal: When the price touches the lower band, indicating potential buying pressure.
- Sell Signal: When the price touches the upper band, indicating potential selling pressure.

Advanced Topics and Trends: Maximizing Your Trading Potential
1. Combining Indicators for Better Results
Combining multiple indicators can provide more robust trading signals. For example, using RSI with Bollinger Bands can confirm overbought or oversold conditions, increasing the accuracy of your trades.
2. Custom Indicators and Scripts
TradingView allows users to create custom indicators and scripts using Pine Script. This flexibility enables traders to develop unique strategies tailored to their specific needs.
3. Automated Trading with Indicators
By integrating TradingView indicators with trading bots, traders can automate their strategies and execute trades without manual intervention. This approach can improve efficiency and consistency in trading.
Practical Tips and Best Practices for Using TradingView Indicators
1. Backtesting Your Strategies
Before applying indicators in live trading, backtest your strategies on historical data. This practice helps evaluate the effectiveness of your indicators and refine your approach.
2. Avoiding Indicator Overload
Using too many indicators can lead to conflicting signals and confusion. Stick to a few reliable indicators that complement each other and align with your trading style.
3. Staying Updated with Market News
Indicators are powerful tools, but they should be used in conjunction with fundamental analysis. Stay informed about market news and events that could impact your trades.

FAQs: Addressing Common Questions about TradingView Indicators
What are the best indicators for beginners?
For beginners, simple indicators like RSI, MACD, and moving averages are recommended due to their ease of use and effectiveness in identifying trends and reversals.
How often should I update my indicator settings?
It depends on your trading style and market conditions. Regularly review and adjust your settings to ensure they remain relevant and effective.
Can I rely solely on indicators for trading decisions?
While indicators provide valuable insights, it’s essential to consider other factors like market news, economic data, and risk management principles for well-rounded trading decisions.
Pros and Cons of Using TradingView Indicators
Pros
- Visual Clarity: Indicators provide clear visual signals, simplifying the decision-making process.
- Customizability: Traders can tailor indicators to match their unique strategies and preferences.
- Automation: Integrating indicators with trading bots can automate trading and improve efficiency.
Cons
- Lagging Signals: Some indicators may lag behind price movements, leading to delayed signals.
- False Signals: Indicators are not foolproof and can sometimes generate false signals.
- Overreliance Risk: Relying solely on indicators without considering other factors can be risky.

Unlock Your Trading Potential with the Best TradingView Indicators
TradingView indicators are invaluable tools that can elevate your trading game. By understanding how these indicators work and integrating them into your strategy, you can make more informed decisions and increase your chances of success. Remember to backtest your strategies, stay informed about market news, and avoid overloading your charts with too many indicators.
Ready to Take Your Trading to the Next Level?
Explore our AI trading indicator designed to help you make more consistent and profitable trades. Sign up for our 7-day free trial and gain access to our free online training center. Visit www.wifientrepreneur.com/training-center and www.AITradingSignals.co to start your journey towards smarter trading today!

