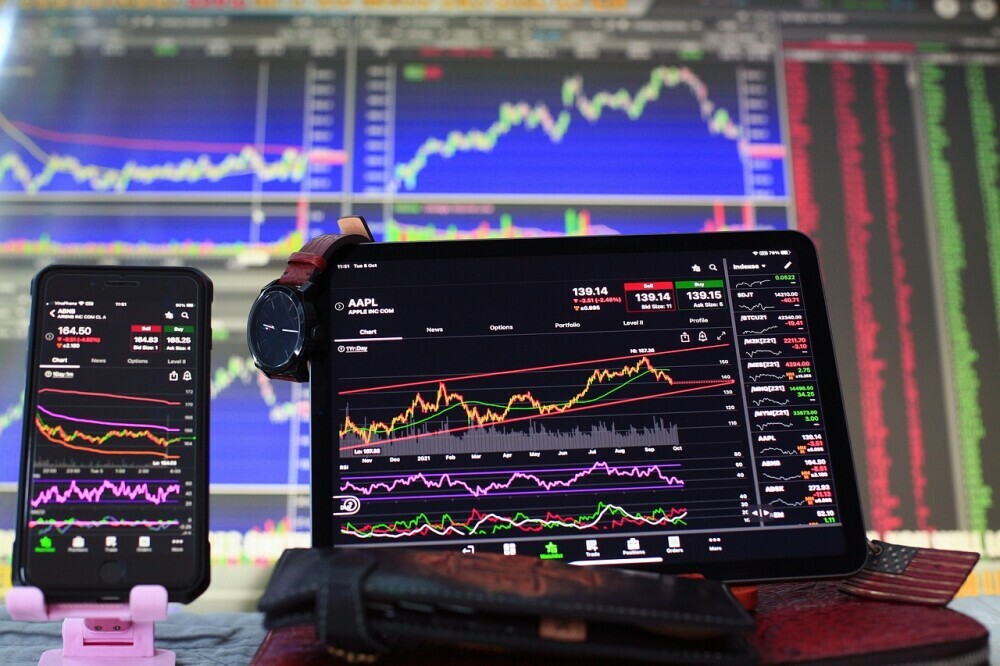
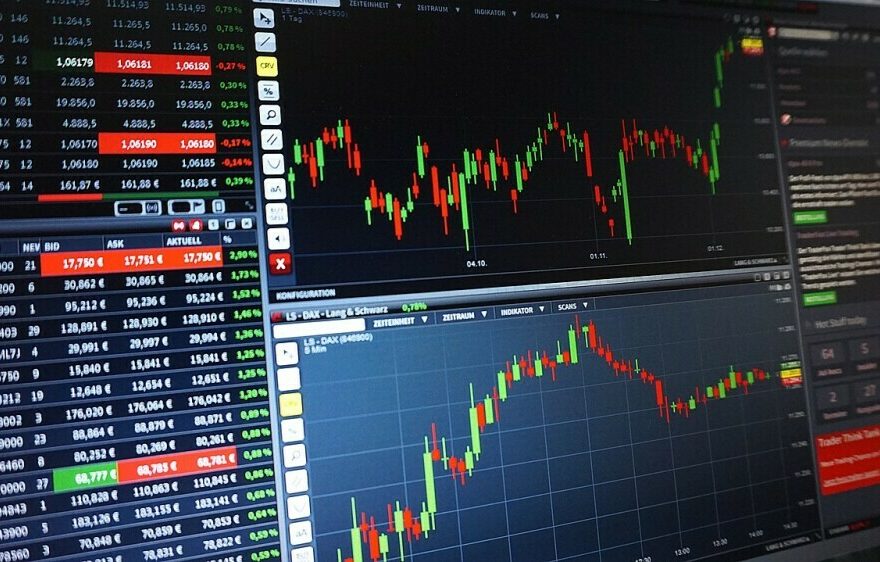
Trading can be both thrilling and profitable, but to truly succeed, you need the right tools. TradingView is one of the most popular platforms for traders of all levels, offering a wide array of indicators that can help you make informed decisions.
In this guide, we’ll explore the best indicators on TradingView that can elevate your trading game, whether you’re dealing with stocks, crypto, or forex.
We’ll also introduce you to an advanced AI trading indicator that promises consistent profitable trades, perfect for both beginners and experienced traders.

The Power of TradingView Indicators
TradingView is a powerful charting platform that offers traders access to an extensive library of indicators. These indicators analyze market data and provide insights into price movements, helping traders make informed decisions. Whether you’re a novice or a seasoned trader, understanding and utilizing the best indicators can significantly enhance your trading strategy and profitability.
Understanding Trading Indicators
What Are Trading Indicators?
Trading indicators are mathematical calculations based on historical price, volume, or open interest data. These calculations are used to predict future price movements and market trends. Indicators can be categorized into leading indicators, which predict future price movements, and lagging indicators, which confirm trends that have already started.
Why Use Trading Indicators?
Using trading indicators helps traders:
- Identify trends
- Spot potential entry and exit points
- Manage risk
- Confirm market conditions
By incorporating these tools into your trading strategy, you can make more informed and strategic decisions.

The Best Indicators on TradingView
TradingView offers a plethora of indicators, but some stand out due to their reliability and the actionable insights they provide. Let’s dive into the top indicators you should consider.
1. Moving Average (MA)
What is Moving Average?
A Moving Average (MA) smooths out price data to create a single flowing line, making it easier to identify the direction of the trend. There are several types of moving averages, with the Simple Moving Average (SMA) and Exponential Moving Average (EMA) being the most popular.
How to Use Moving Average
- Identify Trends: A rising MA indicates an uptrend, while a falling MA suggests a downtrend.
- Support and Resistance Levels: MAs can act as dynamic support and resistance levels.
- Crossovers: When a short-term MA crosses above a long-term MA, it can signal a potential buy. Conversely, a short-term MA crossing below a long-term MA can signal a sell.
2. Relative Strength Index (RSI)
What is RSI?
The Relative Strength Index (RSI) is a momentum oscillator that measures the speed and change of price movements. It ranges from 0 to 100 and is used to identify overbought or oversold conditions.
How to Use RSI
- Overbought/Oversold: An RSI above 70 indicates overbought conditions, while an RSI below 30 indicates oversold conditions.
- Divergence: When the price makes a new high or low that is not confirmed by the RSI, it can signal a potential reversal.
3. Bollinger Bands
What are Bollinger Bands?
Bollinger Bands consist of a middle band (SMA) and two outer bands that are standard deviations away from the middle band. These bands expand and contract based on market volatility.
How to Use Bollinger Bands
- Volatility: Wide bands indicate high volatility, while narrow bands indicate low volatility.
- Breakouts: When the price breaks above or below the bands, it can indicate a strong move in that direction.
4. MACD (Moving Average Convergence Divergence)
What is MACD?
The MACD is a trend-following momentum indicator that shows the relationship between two moving averages of a security’s price. It consists of the MACD line, the signal line, and the histogram.
How to Use MACD
- Crossovers: A bullish crossover occurs when the MACD line crosses above the signal line, and a bearish crossover occurs when it crosses below.
- Histogram: The histogram shows the difference between the MACD line and the signal line. A rising histogram indicates increasing momentum.
5. Fibonacci Retracement
What is Fibonacci Retracement?
Fibonacci retracement is a tool that uses horizontal lines to indicate areas of support or resistance at the key Fibonacci levels before the price continues in the original direction.
How to Use Fibonacci Retracement
- Identify Support and Resistance: Plot the Fibonacci retracement levels on a significant price move, and use the levels to identify potential support and resistance areas.

Advanced Topics and Trends
Emerging Indicators on TradingView
TradingView continuously updates its library with new and innovative indicators. Staying updated with these can provide a competitive edge.
1. Volume Profile
Volume Profile is an advanced charting study that displays trading activity over a specified time period at specified price levels. It shows where the most trading has taken place, helping traders identify strong support and resistance levels.
2. Ichimoku Cloud
The Ichimoku Cloud is a comprehensive indicator that defines support and resistance, identifies trend direction, gauges momentum, and provides trading signals. It’s particularly popular in forex trading but can be applied to other markets as well.
Incorporating AI in Trading
AI and machine learning are revolutionizing trading by providing predictive analytics and automated trading strategies. An AI trading indicator can analyze vast amounts of data, recognize patterns, and make predictions with a high degree of accuracy.
Benefits of AI Trading Indicators
- Efficiency: AI can process data faster and more accurately than humans.
- Consistency: AI follows predefined rules without emotional interference.
- Scalability: AI can manage multiple trades simultaneously.
Practical Tips and Best Practices
How to Choose the Right Indicator
- Understand Your Trading Style: Different indicators suit different trading styles (e.g., scalping, day trading, swing trading).
- Test Indicators: Use TradingView’s backtesting feature to test how indicators perform with historical data.
- Combine Indicators: Using multiple indicators can provide more reliable signals.
Best Practices for Using Indicators
- Keep it Simple: Avoid cluttering your chart with too many indicators.
- Stay Updated: Regularly update your knowledge about new indicators and trading strategies.
- Risk Management: Always use indicators in conjunction with a solid risk management plan.

FAQs About TradingView Indicators
What is the best indicator for beginners?
For beginners, the Moving Average is a great starting point due to its simplicity and effectiveness in identifying trends.
Can I use multiple indicators at once?
Yes, combining multiple indicators can provide more comprehensive insights. However, be careful not to overcomplicate your analysis.
How often should I update my indicators?
Regularly review and update your indicators to ensure they remain effective under changing market conditions.
Are TradingView indicators free?
Many indicators on TradingView are free, but some advanced indicators require a premium subscription.
Pros and Cons of Using TradingView Indicators
Pros of Using TradingView Indicators
- Wide Variety: Access to a vast library of indicators.
- User-Friendly: Intuitive interface makes it easy to apply and customize indicators.
- Community Support: Active community provides shared indicators and strategies.
Cons of Using TradingView Indicators
- Over-Reliance: Relying solely on indicators without understanding market fundamentals can be risky.
- Lagging Indicators: Some indicators lag behind the market, which can delay signals.

Your Path to Consistent Profits
TradingView indicators can significantly enhance your trading strategy by providing valuable insights into market trends and price movements. By choosing the right indicators and using them effectively, you can improve your trading decisions and achieve more consistent profits.
Start Your Trading Journey Today
Ready to take your trading to the next level? Try our AI trading indicator for free for 14 days. Perfect for beginners and seasoned traders, our AI indicator offers consistent profitable trades and guides you in setting up automated trading bots for crypto. Visit our free online training center at wifientrepreneur.com/training-center and explore our offerings at AITradingSignals.co.

