In the fast-paced world of trading, having the right tools can make all the difference. One of the most powerful tools available to traders today is the buy-sell indicator on TradingView.
Whether you’re a beginner looking to get started in trading or an experienced trader seeking more consistent profits, understanding how to effectively use these indicators can significantly enhance your trading performance.
This article will explore everything you need to know about buy-sell indicators on TradingView, from foundational knowledge to advanced strategies, and practical tips to FAQs. Let’s dive in!
The Power of Buy-Sell Indicators in Trading
Trading can be a lucrative endeavor, but it often seems complex and daunting, especially for beginners. However, tools like buy-sell indicators simplify the process by providing clear signals on when to buy and sell. This simplicity makes it easier to make informed decisions, potentially increasing your profitability.
TradingView, a popular platform among traders, offers a variety of buy-sell indicators that cater to different trading styles and asset classes, including stocks, crypto, and forex. These indicators are perfect for beginners starting their trading journey and seasoned traders looking for more consistent profits.
Why Buy-Sell Indicators Matter
Buy-sell indicators are designed to help traders identify optimal entry and exit points in the market. They are based on technical analysis and historical data, making them a reliable tool for predicting market movements. By using these indicators, traders can:
- Enhance Decision Making: Make informed trading decisions based on data-driven signals.
- Reduce Emotional Trading: Follow objective signals rather than emotional impulses.
- Increase Profitability: Identify profitable trading opportunities with higher accuracy.
Understanding Buy-Sell Indicators on TradingView
What Are Buy-Sell Indicators?
Buy-sell indicators are technical analysis tools that signal when to buy (enter a trade) or sell (exit a trade) an asset. These indicators are often based on mathematical calculations involving price, volume, and other market variables. Common types of buy-sell indicators include moving averages, oscillators, and trend indicators.
How Do They Work?
Buy-sell indicators analyze historical price data to identify patterns and trends. They use this analysis to generate signals that suggest whether an asset is likely to increase or decrease in value. For instance, when a stock’s price crosses above a moving average, it might generate a “buy” signal, indicating that the price is expected to rise.
Popular Buy-Sell Indicators on TradingView
- Moving Average Convergence Divergence (MACD): A trend-following indicator that shows the relationship between two moving averages of an asset’s price.
- Relative Strength Index (RSI): An oscillator that measures the speed and change of price movements, indicating overbought or oversold conditions.
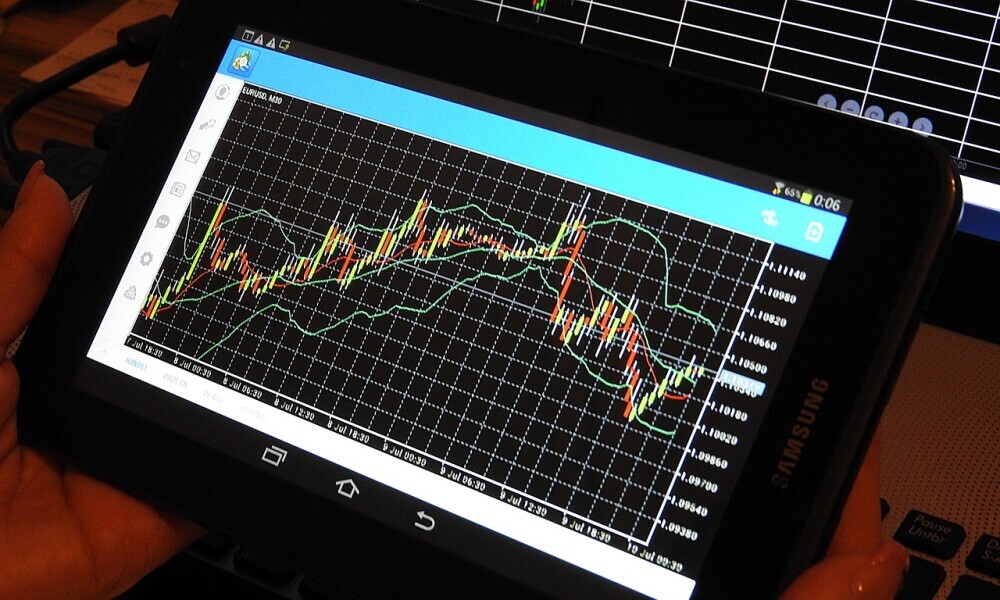
- Bollinger Bands: A volatility indicator that shows the range within which an asset’s price is expected to trade, helping identify potential breakouts.
- Stochastic Oscillator: Compares an asset’s closing price to its price range over a specific period, providing signals of overbought or oversold conditions.

Advanced Topics and Trends in Buy-Sell Indicators
Emerging Trends in Technical Analysis
The world of technical analysis is constantly evolving, with new indicators and strategies emerging regularly. Staying updated with these trends can give you an edge in trading. Some of the current trends include:
- AI and Machine Learning: Leveraging artificial intelligence to develop more sophisticated and accurate buy-sell indicators.
- Algorithmic Trading: Using automated trading systems to execute trades based on predefined criteria, reducing the impact of human error.
- Sentiment Analysis: Incorporating social media and news sentiment into technical analysis to predict market movements.
Combining Indicators for Better Signals
Using multiple indicators can provide more reliable signals by confirming the trends suggested by individual indicators. For example, combining MACD with RSI can help confirm buy or sell signals, reducing the chances of false signals.
Backtesting Strategies
Backtesting involves testing your trading strategy using historical data to see how it would have performed in the past. This can help you refine your strategy and increase its effectiveness. TradingView offers robust backtesting features that allow you to test and optimize your buy-sell indicator-based strategies.
Practical Tips and Best Practices
Tips for Beginners
- Start Simple: Begin with one or two indicators and gradually add more as you become comfortable.
- Use Demo Accounts: Practice trading with virtual money before risking real capital.
- Learn Continuously: Stay updated with the latest trends and strategies in technical analysis.
Best Practices for Consistent Profits
- Set Clear Goals: Define your trading goals and risk tolerance before starting.
- Stick to Your Plan: Follow your trading plan and avoid making impulsive decisions.
- Monitor Your Trades: Regularly review your trades to learn from your successes and mistakes.

FAQs About Buy-Sell Indicators on TradingView
What Is the Best Buy-Sell Indicator for Beginners?
For beginners, the Moving Average Convergence Divergence (MACD) and Relative Strength Index (RSI) are excellent starting points due to their simplicity and effectiveness.
Can Buy-Sell Indicators Guarantee Profits?
No, buy-sell indicators cannot guarantee profits. They are tools to assist in making informed decisions, but market conditions and other factors can affect outcomes.
How Do I Add Buy-Sell Indicators on TradingView?
To add buy-sell indicators on TradingView, open a chart, click on the “Indicators” button, and select the desired indicator from the list.
Are There Free Buy-Sell Indicators on TradingView?
Yes, TradingView offers a variety of free buy-sell indicators. However, some advanced indicators may require a subscription.
How Often Should I Check My Buy-Sell Indicators?
The frequency depends on your trading style. Day traders may check indicators multiple times a day, while long-term investors might review them weekly or monthly.
Pros and Cons of Using Buy-Sell Indicators
Pros
- Objective Analysis: Provides data-driven signals, reducing emotional trading.
- Time-Saving: Simplifies the analysis process, saving time for traders.
- Versatility: Applicable to various asset classes, including stocks, crypto, and forex.
Cons
- False Signals: Indicators can sometimes generate false signals, leading to potential losses.
- Lagging Nature: Some indicators may lag behind market movements, missing early signals.
- Over-Reliance: Relying solely on indicators without considering other factors can be risky.

Take Your Trading to the Next Level
Buy-sell indicators on TradingView are powerful tools that can significantly enhance your trading performance. By understanding how to use these indicators effectively and staying updated with emerging trends, you can make more informed trading decisions and increase your chances of consistent profits.
Remember, while buy-sell indicators are valuable, they should be used as part of a comprehensive trading strategy that includes risk management and continuous learning.
Start Your Free Trial Today!
Ready to take your trading to the next level? Try our AI trading indicator for stocks, crypto, and forex traders. With a 14-day free trial available inside our free online training center, you’ll get hands-on experience and see the difference our indicators can make. Visit our training center or go to AITradingSignals.co to start your free trial today!


